A Foray Into Learner Experience Design

Acknowledgment

The inspiration for this post came from Joyce Seitzinger (web site: www.lxdesign.co, twitter @catspyjamasnz) and her leadership in the arena of learner experience design.

Background

I have developed a range of different materials for different subjects since the mid 1990s. In terms of generating a positive emotional response, the most successful of these was a paper handout where learners had to puzzle out for themselves how to assemble fragments to computer code to achieve a required outcome. The responses ranged from quiet, but still audible, expressions of satisfaction to loud exclamations of success. But for all the materials that I developed the concept of learner experience design was something of an assumption: I was too focused on producing material that was concise, complete and accurate. The time has come for me to turn this around and produce something focused primarily on learner experience design, and treat the subject matter as a given. (The result of this exercise can be found here.)

Discussion

I wanted to design and build something completely from scratch. This immediately eliminated all existing learning management systems and other software aimed at creating interactive learning experiences. This had a downside: learners would not have a record of their progress.

There then came the issues of the target learners, and the subject matter. My own work with adult learners immediately suggested this group, and my own familiarity with mathematics suggested the topic of fractions.

The criteria for success came next. I chose the following:

  1. How well did the result reflect the expectations and background of mature learners?
  2. Did the result strike an effective balance between visual monotony and visual overload?
  3. How well did the material draw on experiences that mature learners are likely to have?
  4. How easily would learners be able to navigate their way around the material?
  5. Was the material chunked logically?
  6. Was each chunk of an appropriate size for the concept or concepts that it contained?
  7. Did all the material make a coherent whole?
  8. Were there opportunities for self-assessment?

Experience

My original intention was to provide a complete guide on working with fractions (addition, subtraction, multiplication, division, and simplification) and designed the front page accordingly. When I came to writing material for each of the chunks, two things became very apparent. The chunks were in the wrong order, and there was too much material for all the navigation points to be shown on a single display. This failed two of the success criteria: navigation, and logical chunking. Being as I was both a content creator and a subject expert, I took the decision to omit multiplication and division from the result. I also discovered that I needed an extra chunk to precede the multiplication and division chunks that I had not thought about when I first chunked the material. While the original order might have made sense from the viewpoint of keeping related ideas together, it would have been a disaster from a pedagogical viewpoint.

The choice of what examples to use also arose. My own experience of materials about fractions left me feeling somewhat jaded: just how often are pizzas divided into equal segments in these materials? I used examples and photographs of items in my own house: coins, a lemon, a box of eggs, and an empty avocado tray. I also produced a graphic of a fuel gauge.

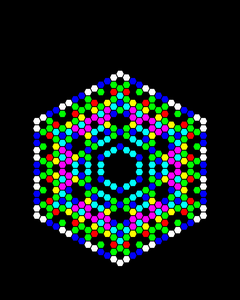
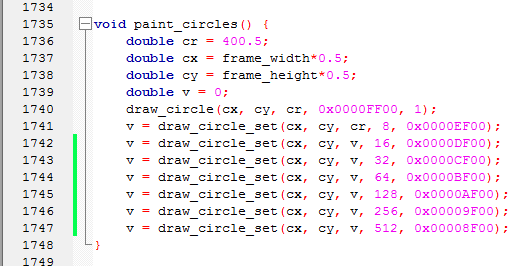
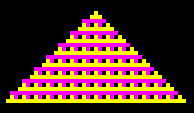
I had a very particular idea of how I wanted fractions to be displayed. All the usual packages failed to match my requirement, so it was a case of write my own application to do that, and use GIMP to process the images into something suitable for display on a web page.

Criticisms of the Result

While the result could be described as “adequate” when it comes to the success criteria, the following observations could be made:

  1. The result will not work on mobile devices: the required display size is too large, and the result has no mobile equivalent.
  2. The learner requires an HTML5 web browser.
  3. The use of an avocado tray in the context of an avocado farm probably lies outside the direct experience of most people.
  4. Some learners may find the style too terse.
  5. The chunk on simplifying fractions properly belongs to the (non-existent) pages concerned with multiplying and dividing fractions.
  6. The result has not been trialed.
  7. The result is not compliant with standards such as SCORM.

Lessons Learned

The next time that I prepare such material, I will be able to do so with a more informed perspective.

An Essay on Instructional Design

Acknowledgments

I thank both Jo Hart (Twitter @JoHart, blog johart1.edublogs.org/) and Michael Graffin (Twitter @mgraffin, web site www.mgraffin.com/) for inspiring me to write this post.

On Learning About Instructional Design

When Jo mentioned instructional design in conversation, I realised that while I was acquainted with the term and that it was to do with designing and building educational experiences for learners, I was quite ignorant of exactly what it is that constitutes instructional design, and I regarded this as a quite unsatisfactory state of affairs. A little bit of research soon threw up the following resources:

As I worked my way through these articles, I realised that I had been here before 40 years ago, though in a different context. I was looking at how systems are first analysed, and then designed.

On Analysing Systems

In the business context, the phrase “systems analysis” means producing a model of how part or all of the business works, usually with a view to improving the way that the business operates. This is then followed by “systems design” with the outcome that existing systems are modified to meet the current business objectives, usually increased profits in the case of commercial business.

Translating this into the educational arena, this means producing a model of how education works at the classroom level, and then designing educational experiences to meet the current educational objective, to wit better educated people.

Further Comparison

There are many formal systems for undertaking systems analysis in the business context. This matches the plethora of models of how people learn.

There are many systems design methodologies in the business context. Again the same is true in the educational context: one has only to look at the differing viewpoints in the five links above.

As one trainer in systems analysis and design once said to a class of which I was a part, it is about having a toolbox of methods, and choosing an appropriate method for the situation that you are currently looking at. I think the same holds in the educational context.

The Author’s Toolbox

The concept of instructional design is relevant to all three domains of learning: affective, psycho-motor, and cognitive. However, due to my limited experience in two of them, I address only the cognitive domain.

The model of learning that is presented below results from using the following tools:

  • Observing how learners succeed, and how learners fail, when going through a learning activity.
  • Observing learners’ emotional responses to a range of learning environments and learning activities.
  • Observing the differences in knowledge between different learners in the same cohort.
  • Observing the different rates at which different learners learn.
  • Observing the different different types of question asked by learners of different ages.
  • Observing how students react to different styles of presentation.
  • Observing group dynamics
  • Observing how learner motivation changes over time, and considering what might be causing those changes.
  • Observing how understanding of high school mathematics is dependent on understanding previous concepts.
  • Observing similarities and differences between academic endeavour and commercial endeavour.
  • Observing change of subject matter over time.
  • Asking questions.

A Model of Learning

I claim to have some learning in the areas of mathematics and of information technology, and I use both contexts in what I am about to say.

It seems to me that it is impossible to have the concept of a fraction until you have grasped the concept of a whole: there is a whole cake, take a piece out of it, and you have a fraction of a cake. The same applies to information technology: until you are acquainted with spreadsheets, the term “cell address” is meaningless. In both cases, understanding the second idea is crucially dependent on having a good grasp of the first idea. This is a constructivist approach.

There is also the question of “Why bother to learn?”, this addressing the issue of student motivation. This plays a crucial part when it comes to designing delivery activities and materials.

Relevance of information also plays a part. Applied mathematics changes very slowly, while practice in information technology changes very rapidly. Information that was relevant 10 years ago may be entirely irrelevant today: the floppy disk serves as a paradigm for this. This has implications not just for the professional development of educators, but also for the materials that they use.

The way that learners prefer to study also differ. At one extreme, there are learners who much prefer to work through a learning activity on their own. At other extreme, some learners need a lot of support from their teachers and peers.

Devices for Developing Learning Activities and Materials

The ideas offered below are neither complete nor prescriptive. They again come from my toolbox. Readers must decide for themselves which of those ideas are relevant to their own context.

  • Identifying goals, sub-goal, and sub-sub-goals until you end up with something small enough to be a single learning activity. Verifying that the sequence in which the material is going to be present is logical. This is an iterative process that continues until the summative assessment, if any.
  • Project management:
    • establishing existing levels of knowledge in the learners
    • identifying which learning goals will be achieved by when (aka scheduling)
    • identifying the human resource implications (crucial if you happen to be team teaching)
    • identifying costings where appropriate.
  • Identifying the resources needed for any learning activity, and either locating same or preparing your own.
  • For every planned learning activity, checking the following:
    • relevance
    • completeness
    • correctness, particular for task-analysed activities
    • unambiguousness
    • accessibility
  • Incorporating feedback from the learners into existing and planned learning activities.

In light of the increased use of information technology in learning activities, it is perhaps worthwhile going into some detail about making online learning activities more accessible. At the risk of stating the obvious, merely converting an existing printed document into an online form does nothing to increase the accessibility of the material being learned. The advantages of an online learning environment include, but are not limited to:

  • Immediate feedback on assessment tasks
  • Access to live data
  • Increasing or reducing the challenge presented to the learner on the basis of the learner’s answers (adaptive assessment)
  • Opportunities for independent research
  • Choice of route towards a learning objective
  • Audio and video material
  • Being updated for new information – current news stories are relevant here
  • Being updated for correctness

The choice of route towards a learning objective takes on an even bigger role in online learning. While printed material tends to very linear, online learning lends itself to having multiple pathways, so signposting becomes very important.

An Invitation

Please add your observations and additions in the Comment box below. Thank you.

Windows 10: a Warning to Those Who Would “Free” Upgrade

Microsoft have been pushing very hard their free upgrade to Windows 10 for Windows 7, Windows 8 and Windows 8.1 users.

I followed their instructions to make myself an installation disk for Windows 10.

I installed Windows 10 on my computer in the usual manner. During that installation process, the installer had the opportunity to check the state of my C: drive, and establish that there was a valid copy of Windows 7 already present. It seems that it failed to do so.

Following good practice, I deleted all the partitions from my C: drive, removing the clutter that inevitably builds up over time.

After I installed Windows 10, it kept demanding that I give it an activation key. The Windows 7 key did not work.

After about 20 attempts, I finally got through to Microsoft’s support line. I was told because of the way that I had gone about it, I would need to purchase an activation key.

I am not impressed.

Maths Phobia: an Unconventional View

Introduction

This post is based on a mixture of personal experience and information that can be found on the Internet. It makes no claim to be scholarly in any sense. However, I hope that it might serve to provoke informed discussion about the perennial issue of maths anxiety.

Recollections

I have been a numerate person for as long as I can remember, and I attribute this to the generally good understanding of maths by all my school teachers. In my middle years, I was trained as a teacher by teachers who themselves modelled best practice. A few years ago, I was accepted to run a workshop aimed at addressing maths anxiety in participants. It seemed to me that the logical thing to do was to give a sample session on maths while modelling best practice. The results surprised me. While some participants felt they had benefited, others went away feeling even more anxious about maths. The time has come to put that experience into a wider context.

Other Sources

There is a growing body of evidence of differences in what is happening in the brain between people who suffer from maths anxiety and those who do not. Ruth J. Hickman wrote this piece which is suitable for the general reader. For people more interested the neurological basis of maths anxiety, there is this article by Ian M. Lyons and Sian L. Beilock. These are just two examples that can be found on the Internet, and there are plenty more.

A Wider Perspective

While there is a wealth of self-help techniques available on the Internet, I think that they miss the point: anxiety is a psychological condition, and it should be treated first and foremost by a clinical psychologist, and done so in conjunction with a maths teacher who understands the existing maths skills and knowledge of the anxious person. There appears to be very little discussion on this approach, and while it may seem a “suggestion too far” for some people, I hope it provokes comment from others. Given the cost to society of innumeracy, can we afford not to involve psychologists in this?

#30GoalsEDU Conference: a Presenter’s Reflection

Inspire Leader

Introduction and Background

I was delighted when Shelly Terrell (Twitter: @ShellTerrell, blog http://www.shellyterrell.com/about.html) invited me to give a keynote presentation at the 30 Goals E-Conference in July of 2015 on the topic of silos and connectivism. When I sat down to start preparing slides for the presentation, I had expected to go through the usual process of doing a “brain dump”, leaving the material to organise itself as I went from slide to slide. I went into Google Slides, looked at the blankness, and realised that I had nothing to work with. Yes, I had a few personal memories, and I was aware of headlines about what the Finns were doing, but there was nothing of any real substance that I could use.

Research Time!

The time had come to dig into what was behind the headlines in the news outlets, find out what was currently happening in schools and universities both inside and outside Finland, and read curriculum documents. As a research activity, it was all fairly routine. One thing that surprised me was the degree to which headlines could be wide of the mark, with the most extreme being “Finland schools: Subjects scrapped and replaced with ‘topics’ as country reforms its education system” from the Independent Newspaper of 20 March 2015 (accessed 19 July 2015). I found the educational articles available from both the Finnish government’s web site and the Finnish universities to contain a wealth of useful information.

Organising it All

The next step was to organise all the material into a coherent whole. The simplest way to do it was to produce this document which then served as a basis for the presentation. I wrote the speaker’s notes as usual.

The Presentation

Most of my presentations include a lot of text, and I use that as a prompt for what I am about to say. This presentation was quite different: it was almost entirely images. The first rehearsal of the presentation was too short in both content and time. I did a little more research, found some extremely useful material, and added it in. The second rehearsal suffered from two issues: (1) my delivery was hesitant due to the lack of on-screen textual clues, and (2) I was focused on delivering a presentation rather than trying to “sell a message”. There was no time for a third rehearsal, so I had to trust that I would be able to do two things: (1) read the speaker’s notes, and ad lib accordingly, and (2) change my mental focus in the next 14 hours (which included a period of sleep).

Shortly before I was due to present, I was warmly greeted by Jake, Judy and Shelly: their support was extremely helpful. When the time came, Shelly delivered a wonderful introduction, and I was then “on show”. The change of mental focus worked. The writing of the document helped me to ad lib easily from the speaker’s notes. From my own viewpoint, the presentation went as well as I could have hoped. The discussion that followed suggested that I had got my message across. A recording of the presentation can be found here.

Lessons Learned

I have learned two things. The first is that I am not there to deliver a “perfect presentation” but to convince an audience. The second is to trust my own speaker’s notes.

Another day, another lesson learned. 🙂

Hexagonalia

Acknowledgment

This post owes its existence to a friend of a friend who asked about how the image below was created. This post is my answer to his question.
mug

Of Cellular Automata in General

A picture is worth a thousand words, so I’ll start with an animated picture from a famous cellular automaton:
Game_of_life_pulsar
(Image courtesy of Nathaniel Johnston who has placed it in the public domain.) This animation is a “period 3 oscillator”. The black cells are “alive”, and the white cells are “dead”. At each stage, the cells that are alive in the next generation are governed by the cells that are alive in the present generation. This example comes from John Horton Conway’s Game of Life. The rules that govern which cells become alive and which cells die can be found here.

This is an example of a “square” cellular automaton, and is one of the three regular tilings of the plane, the other two being triangular and hexagonal:

triangular hexagonal

Cellular automata are not limited to tilings of the plane, nor are they limited to being organised in any particular or regular pattern. Moreover, there is no requirement for the “life” of any cell to be governed by immediately adjacent cells, nor indeed for the state of any particular cell to be binary. However, for the purposes of study it is convenient to limit oneself to regular tilings of the plane, the cell itself, and immediately adjacent cells, all cells being binary in value.

The Game of Life defines a function from one time step to the next, and has three possible values for every cell in the automaton:

  1. Birth
  2. Persistence
  3. Death

This can be expressed in more mathematical terms as:

  1. f(x) = 1
  2. f(x) = x (i.e. the identity function)
  3. f(x) = 0

The Game of Life uses the values of nine cells (eight adjacent plus the cell itself) when calculating f. Generalising this to the other two regular tilings yields:

  Triangular Square Hexagonal
Count 13 9 7

There is also appeal in generalising f as follows:

  1. f(x) = 1
  2. f(x) = x (i.e. the identity function)
  3. f(x) = 1-x (i.e. the inversion, or binary “not”, function)
  4. f(x) = 0

For the sake of both clarity and brevity in the rest of this post, it is convenient to use the word “machine”. The machine for the Game of Life looks like this:
machine_gol
In this scenario, the Game of Life is just one of 49 different machines, and can be notated as “000001I00”. The image at the top of this post is based on 47 different machines, the majority of which turn out to be quite boring. The following comments apply to all machines:

Notation Observations
000 … 000 All cells are “dead” after the first generation
III … III Nothing changes
VVV … VVV Every second generation is the same – the whole automaton merely inverts at every generation
111 … 111 All cells are “alive” after the first generation

Some cellular automata result in an ever growing number of “live” cells. The example below is from the Game of Life. It was made by Kieff, and is reproduced under a CC BY-SA 3.0 licence:
Gospers_glider_gun

Of Some Particular Hexagonal Cellular Automata

The machines used in the creation of the image at the top of this post started with the following question: “If I start with a single live cell, what happens to it under the complete range of machines?”. It turns that some of them grow forever. The first 17 generations of machine “0000I10” look like this:
0000130
The natural extension of this idea is “What do successive (and not ‘boring’) machines look like at the same generation?”, to which this is a typical answer at generation 13:
generation_13
and you can see machine 0000I10 at generation 13 (filename 0000130.bmp) in both images.

(As an aside, the folder in my computer that contains the generation 13 images has a total of 2,282 files and is 13.3 GB in size.)

Monochrome is all well and good, but adding colour adds visual interest. The easiest way to do this is to take successive triples of images, assign each member of a triple to red, green and blue channels, and combine the result:
0000120
The image immediately above is composed as follows:

Channel Machine
red 0000IV0 (0000120)
green 0000I10 (0000130)
blue 0000VV0 (0000220)

The final step was to arrange the composite hexagons into the image at the top of this post.

And by way of a bonus image, here is machine 000I11I at generation 50 coloured using a completely different algorithm:
0001331

When Coding Meets Art

Acknowledgment

My thanks go to Shelly Terrell (Twitter: @ShellTerrell, blog http://www.shellyterrell.com/about.html) whose tweet “When coding meets art” inspired this post.

Background

I guess most people are familiar with the tools used by painters and other artists: crayons, pencils, brushes, water colours, acrylic, oils and other materials. Computers have become increasingly involved in image creation for both static pictures and movies, as well as computer-based games. With the dramatic fall of the price of computers as well as their ever increasing graphics capability, the young children of today can exploit these devices for their own artistic creations. For children interested in coding, they can also use coding as part of their creative work. This post is a reflection of my own use of coding for some of my own artistic work.
hexagon_3

The Artist’s Goals

I remember using paints and a brush at primary school. My interests moved away from painting, and moved (eventually) into computers. I had no inclination to pick up a paint brush as a young adult, the reason being my inability to achieve the sort of quality of artistry, perfectionism if you like, that I would have demanded of myself. The advent of computers has overcome that barrier.

My own interest mathematics has inevitably influenced my pieces. The mathematical ideas behind my pieces have been expressed as “computer code”:
coding_1
which produced this:
circles

The Technical Challenges

Every artist faces the technical challenges presented by his choice of medium. Painting using a computer is no different. The remainder of this post is given over to describing what is in my experience the foremost of those challenges.

Image Size

If an artist paints on a sheet of paper, the size of the image is fixed. With computers the size of the image can be almost anything. If the intention is to display it only on a computer monitor, then the size can usually be limited to 2000 by 1500 pixels. This number may grow as computer monitors become larger in the future.

If the target is a photographic quality print measuring 8″ by 12″, the size rises to 7200 by 4800 pixels. For an image 48″ by 18″ the size is 28,000 by 10,800 pixels, or over 100 times larger than needed to display on a computer monitor. This presents challenges in how the computer code is designed.

Of Pixels and Equilateral Triangles

It is an uncomfortable fact that almost triangles cannot be accurately represented using conventional computer technology. This applies to equilateral triangles as well:

triangle_1 triangle_2

The image on the left is displayed in its “natural” units on your monitor. The image of the same triangle on the right has been magnified four times, and you can see how that “perfect” slope of 60 degrees has to stagger its way up the rows of pixels. This issue is more visible with computer monitors than with high quality photographic printers. One way around this is to use anti-aliasing, where immediately adjacent pixels are given some of the colour, but this takes a bit more coding effort:

triangle_3 triangle_4

If you compare the two smaller triangles, the lower one has smoother sloping sides. You can see where some of the yellow has been added to the pixels immediately adjacent to the slope in the larger image.

Keeping Things in Proportion

Still on the theme of triangles, larger triangles can be displayed on a computer monitor without too much distortion, but in the case of smaller triangles, the distortion can be significant. When a larger figure composed of lots of small triangles is displayed, this effect is quite obvious.

Again using an equilateral triangle, the smallest possible representation looks like this:
proportion_0
If you put lots of them together, this is what it looks like:
proportion_1
Looking at it a bit more closely, you can see a lot of holes between the triangles:
proportion_2
Just to make matters even worse, the result is quite distorted. The image below has an equilateral triangle added to it:
proportion_3

The way around this is to use a large as grid as possible, but not so large as to cause your computer to run out of memory.

Colour Reproduction

Not all computer monitors are created equal. Even the identical monitors can have different colour temperature settings, meaning that the same image looks different on the two different monitors. The issue is even more pronounced when it comes to printers. Most printers in homes and offices have only four colours. Printers in photographic shops typically use seven colours, and give much better colour reproduction as a result. Here is an example of just how differently the same colour in the artist’s mind appears after it as been printed on a home printer:

colour_1 colour_2

The image on the left is the “original”, and is probably much the same on your monitor as it was on the artist’s monitor. The image on the right is after it was printed (and scanned). While a home printer is okay for a quick check on how a piece looks, there is no substitute for taking it to a photography shop.

Coding Errors

Coding errors are a fact of life, and can manifest themselves in a whole variety of ways. The program might crash. The result might be completely black, or have the wrong colours, or be distorted.

ripples_1 ripples_2

The image on the left was the artist’s intention. The image on the right is the result of two coding errors. This is perhaps no different to an oil-on-canvas painter accidentally putting his brush in the wrong colour. But as any coder will tell you, once you get the required result the feeling of satisfaction can be immense.

HAPPY CODING! 🙂

Silos and Connectivism

Acknowledgment

My thanks go to Shelly Terrell (Twitter: @ShellTerrell, blog http://www.shellyterrell.com/about.html) for prompting me to write this post.

Background

The story starts with an experience towards the end of my high school career when I was studying physics and chemistry (among other subjects). During one particular week the topics being taught were so closely related that I imagined that the two teachers were talking to each other about what they were teaching. I asked one the teachers about this, and he said that they both worked quite independently. This left me with a puzzle for over 45 years. With current discussion in the educational community on the matter of silos and connectivism, now seems like a good time to give that puzzle an airing.

Of Subject Interdependency

Subjects at most high schools are taught quite independently of each other, and yet the links between them are obvious. The study of literature is crucially dependent on a thorough understanding of the language in which the literature is written, often English in English speaking countries. Similarly the study of science is dependent on a reasonable grasp of mathematics.

Speaking from my own background in the sciences, I was learning the mathematics that I was to need in science classes typically one or two years beforehand, a subject that I have always enjoyed. As a consequence, I found the mathematical content of science classes to be trivially easy.

Development – Part 1

There is a theme that I have encountered regularly for decades which is that school leavers avoid reading physics or chemistry at university because in their minds they contain too much mathematics, and instead opt for one of the “softer” sciences such as environmental science or psychology.

There is an area of mathematics known as “statistics”. Understanding statistics depends on first understanding some other “simpler” areas of mathematics. (If you must know what those areas are, they are algebra and calculus.)

At the time of writing Swinburne University of Technology offers a Bachelor Degree in Psychology with a compulsory unit “Foundations of Statistics“. Also at the time of writing Curtin University includes what I would regard as high school mathematics, but without any statistics, in its physical science courses. These two examples come from a few minutes research on the Internet, and reinforce the idea that softer sciences need more powerful mathematical techniques than the physical sciences to obtain meaningful results at the undergraduate level.

We now have all the ingredients necessary to describe a potential problem. Anybody leaving year 12 and opting to study a “soft” science on the basis of their weakness in mathematics is making a big mistake. The cause is perhaps obvious: high school biology, for example, is less about mathematics and more about form and function than either physics or chemistry, leading students to think mistakenly that this will carry over into their university studies.

Development – Part 2

The preceding section identifies two issues. The first issue is the apparent compartmentalisation of knowledge, and is the burden of this post. The second issue of people not understanding what is needed to study soft sciences is beyond the scope of this post, and may be the subject of a future post.

The teaching of different subjects by different teachers is a paradigm based on silos of knowledge. It is up to the student to develop an understanding of how those subjects are related. The idea of a holistic approach to teaching in high schools seems to be regarded as being revolutionary. Finland may be the first country in the world that has addressed the issue of helping students understand the links between traditional subjects. As the Independent newspaper puts it “Subjects scrapped and replaced with ‘topics’“.

This then raises the question of what we should be asking our high school teachers to be teaching. While many teachers might feel threatened by this, I would have expected each of my physics, chemistry and mathematics high school teachers to be comfortable teaching across all three subject areas. A similar case could be argued for history and geography. You could probably suggest your own combination of subjects.

The Future

The reaction from teachers in being asked to engage in cross-disciplinary teaching is perhaps predictable. It came as no surprise to me that the target of the above link includes the words “the reforms have met objections from teachers and heads“. But as Marjo Kyllonen, Helsinki’s education manager, has said “There are schools that are teaching in the old fashioned way which was of benefit in the beginnings of the 1900s – but the needs are not the same and we need something fit for the 21st century.“. I suspect it may be many years before this approach becomes the norm in Westernised countries. I think that it will take the efforts of educators with this vision that will help to shorten the timescale. I see social media, physical conferences and online conferences as being essential communications tools for those educators to talk to each other and the wider community.

I will confess to my own impatience for the advent of holistic teaching.

A Young Child’s Spatial Awareness Observed

Introduction

Peg Tyre is an educator who wrote this article that touches upon Piaget’s ideas that children develop mathematical skills much later than is thought today. Her piece mentions numbers primarily, but the extension to spatial awareness is obvious.

The family next door came over recently, and one of the children took great delight in re-arranging the pieces on our outdoor chessboard. Here is what she produced:chess_board It can be a little hard to see exactly what it looks like, so here is a schematic equivalent with what she produced on the right hand side of this image:chess_men I have highlighted her reflective and rotational symmetries. The block of eight pieces on the right hand side also show translational cross-matching. The child is only five years old, and watching her with a weather eye made it plain that she was going about re-arranging the pieces with quiet deliberation. Also, this was an activity that she initiated and completed without any external prompt.

The æsthetic appeal of what she had produced caught me immediately when I went and stood beside the chess board. What it has taught me is to be on the lookout for numeracy skills in the children that I meet.

A Mathematical “Deception”

Introduction

People often use visual cues to decide whether or not to buy something. How big are those bananas, so how many should I buy of them? The same question gets asked when buying chocolate for Christmas. I was tidying up after last year’s festivities, and I noticed something about one of the empty boxes. Now seems like a good time to explore it.

Judging By Its Size

This is a picture the Christmas box, with an ordinary bar of chocolate put on top of it:Top Viewand here is the same thing seem from the edge:Side ViewFrom a visual perspective, you might expect the box to contain more, possibly a lot more, than is in the simple wrapper. You would be mistaken. The simple wrapper contains 350g. The box contained only 320g. I leave it you estimate the ratios of width, height and depth from these pictures.

A look at the internal carrier was also revealing:CarrierThe individual chocolates are held in the widened “bases” as they appear in this picture. Those things that look like upside-down plastic beakers raise the individual chocolates from the bottom of the box. (The carrier is shown upside-down in this picture.) A comparison of the simply wrapped chocolate with all that empty volume is revealing.

Next Time You Go Shopping …

Next time I go shopping for Christmas, I will be taking a very hard look at the weights printed on the boxes and wrappers!